Confocal and widefield fluorescence microscopy are not interchangeable. This is well understood at the level of sample choice — confocal for thick samples or fine 3D structure, widefield for thin samples and fast acquisition. What is less consistently applied is the corollary: confocal and widefield images require different image analysis approaches, different background subtraction strategies, and different pre-processing corrections. Using the same analysis pipeline for both modalities without accounting for their optical differences is one of the most avoidable sources of quantification error in cell biology.
The Core Optical Difference and What It Means for Analysis
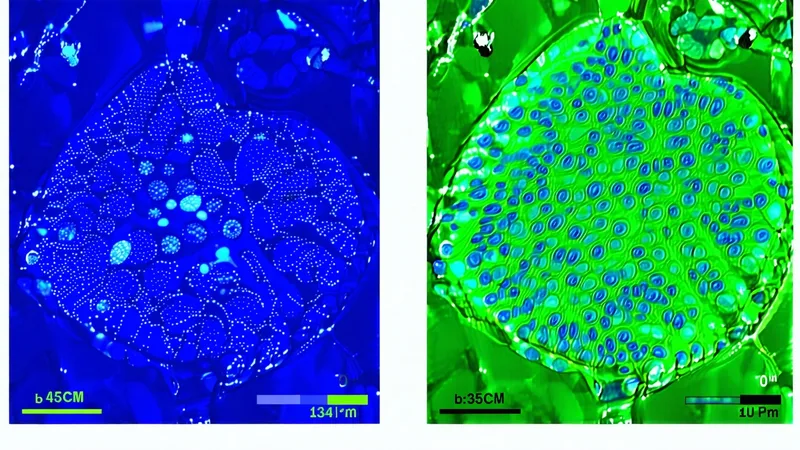
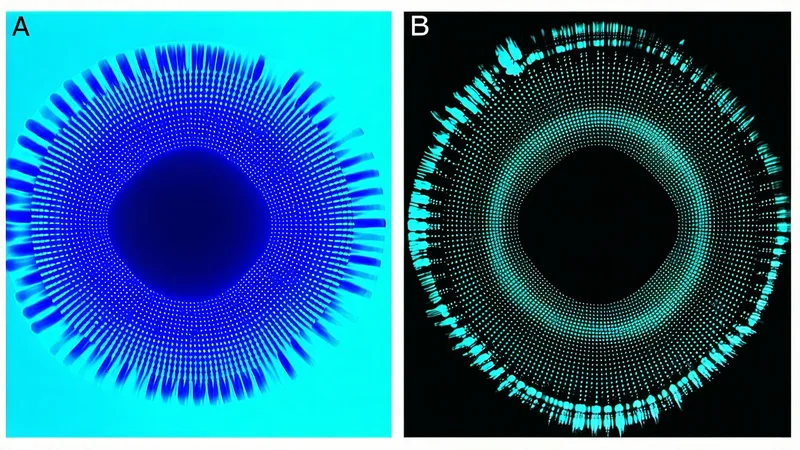
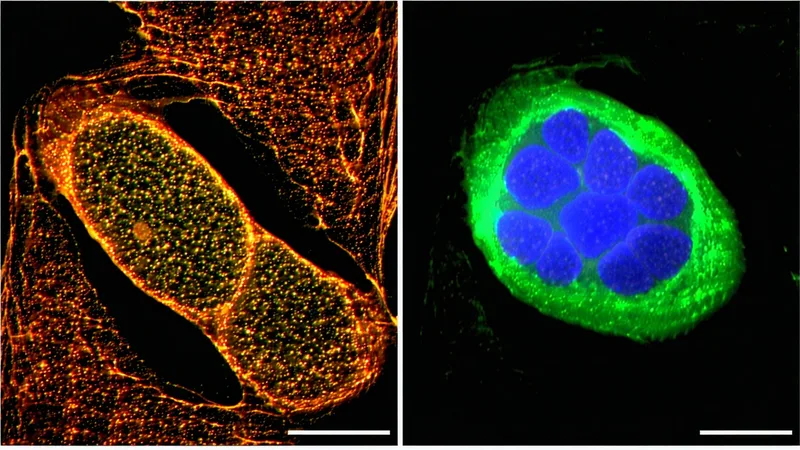
In a widefield epifluorescence system, the entire depth of the sample is illuminated simultaneously, and out-of-focus fluorescence from above and below the focal plane is collected along with the in-focus signal. The result is that a widefield image of a cell with a thick cytoplasm contains fluorescence contributions from planes other than the plane of focus. This out-of-focus light raises the effective background, reduces apparent contrast, and changes the relationship between measured intensity and fluorophore concentration.
Confocal microscopy uses a pinhole aperture that rejects most out-of-focus light, producing optical sectioning. The in-focus signal is a much better approximation of the fluorophore distribution at the focal plane. As a result, confocal images of the same cell will have lower background relative to the in-focus signal, higher apparent contrast, and better separation between the object (cell or nucleus) and the image background.
This difference has direct consequences for image analysis at every step of the pipeline.
Background Subtraction: Different Starting Points
Background subtraction is necessary in both modalities, but the background being subtracted has different character.
Widefield Background
Widefield images have a spatially variable background that includes cell autofluorescence, out-of-focus fluorescence from above and below the focal plane, and contributions from the substrate or mounting medium. The background level in a widefield image is typically higher relative to the signal than in a confocal image, and it varies spatially in a way that reflects both the optical properties of the system and the three-dimensional distribution of fluorophores in the sample.
Rolling-ball background subtraction — implemented in ImageJ/FIJI and most HCS analysis packages — is a common approach for widefield images. The algorithm estimates background by fitting a sphere of defined radius under the image intensity surface. The radius parameter is critical: a radius smaller than the objects of interest will subtract signal from the objects; a radius larger than the distance between objects will fail to capture local background variations. For a typical cell biology experiment with 10 to 20 µm diameter cells, a rolling-ball radius of 50 to 100 pixels at 20x magnification is a reasonable starting range that should be validated on representative images.
Confocal Background
Confocal images have lower background due to optical sectioning, but they still require background correction. Residual out-of-focus haze, photomultiplier tube offset, and autofluorescence from specific cellular compartments (particularly mitochondria in the 488 nm channel) contribute to the confocal background. For confocal data, a simple constant offset subtraction — estimated from a cell-free region of the image — is often adequate and preferable to the rolling-ball algorithm, which can introduce artifacts in high-contrast confocal images by over-subtracting near bright objects.
For confocal z-stacks, the background correction should be applied consistently across all Z planes before any 3D analysis or maximum intensity projection.
Segmentation Thresholds and Object Detection
Segmentation algorithms that use intensity thresholds to separate objects from background are sensitive to the background level in the image. Because widefield images have higher background, the optimal threshold for widefield images is higher relative to the peak signal than the optimal threshold for confocal images of the same biological sample.
An analysis pipeline optimized on confocal data will typically under-segment widefield images: the threshold is set too low, background pixels are called as foreground, and objects appear larger and more connected than they should. Conversely, a pipeline optimized on widefield data will over-segment confocal images: the threshold is too high, dim peripheral regions of objects are excluded, and objects appear smaller and more fragmented than they should.
This matters most for applications where object morphology is a primary readout — nuclear shape descriptors, cell area, and eccentricity measurements are all affected by segmentation boundary accuracy. It also matters for intensity measurements, because the mean intensity of an object depends on which pixels are included in the object mask.
A Common Failure: Applying Confocal-Trained Segmentation to Widefield HCS Data
Consider a drug discovery group that develops their cell health assay on a spinning-disk confocal system and generates training data for a deep learning segmentation model using confocal images. The model performs well on confocal data — high intersection over union on the validation set, clean nuclear boundaries. The assay is then transferred to a widefield 384-well plate reader for library screening.
Applied to widefield data, the confocal-trained segmentation model consistently under-segments: cells at the periphery of the field, where widefield background is highest relative to signal due to illumination non-uniformity, are frequently missed or merged. The per-well cell count is 15 to 25% lower than expected, and the per-cell intensity measurements are skewed toward the brighter cells that were successfully segmented. The Z' factor drops below 0.5 not because the assay biology has changed but because the segmentation model is mismatched to the imaging modality.
The solution is not to abandon deep learning segmentation for widefield data — it is to train or fine-tune the segmentation model on representative widefield images from the target imaging system, and to apply flatfield correction before segmentation to reduce the spatial background variation that caused the peripheral detection failure.
Intensity Quantification: What the Numbers Mean
Fluorescence intensity values measured from confocal single-optical-section images are more directly interpretable as fluorophore concentration at the focal plane than widefield intensity values, which are influenced by out-of-plane contributions. This means that confocal intensity measurements from different Z depths within the same cell reflect true 3D distribution information, while widefield intensity measurements are a convolved mix of multiple focal planes.
We are not saying that widefield intensity measurements are not informative — they are, particularly for assays where the readout is the total fluorescence per cell rather than the spatial distribution of fluorescence within the cell. But the interpretation of widefield intensities must account for the optical contribution from out-of-focus planes, which scales with sample thickness and fluorophore distribution. Comparing widefield intensity measurements between cell types with different sizes and morphologies introduces a systematic bias that confocal measurements at a defined focal plane do not have.
Matching the Analysis Strategy to the Imaging Modality
The practical implication is that analysis protocols should be modality-specific, not modality-agnostic. For widefield data: apply flatfield correction before any analysis; use a rolling-ball or region-of-interest-based background subtraction calibrated to the signal-to-background ratio of the specific instrument and experiment; validate segmentation parameters on images from the specific widefield system; and document all pre-processing steps explicitly.
For confocal data: apply Z-plane-specific flatfield correction for z-stacks; use a constant-offset or local-minimum background subtraction; validate segmentation on representative confocal images; and consider whether single-plane analysis, maximum intensity projection, or full 3D analysis is the most appropriate choice for the biological readout of interest.
The distinction between confocal and widefield is not a technical footnote in the methods section. It is a fundamental property of the data that shapes every downstream analysis decision. Treating the two modalities as equivalent inputs to the same pipeline is a reliable way to introduce quantification errors that are not visible to the eye but are detectable in the numbers — precisely the category of error that compromises the reproducibility of cell biology studies that rely on fluorescence intensity as a primary readout.